Does LHV’s pension fund really beat the index?
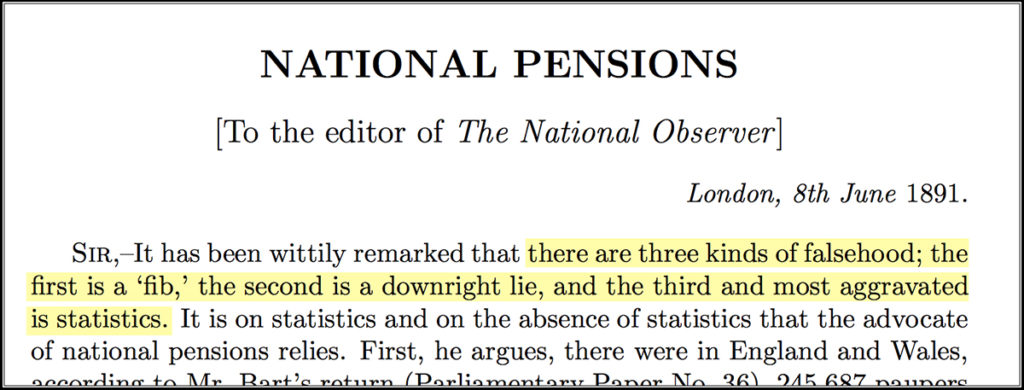
Lies, damn lies and statistics, they say. Did you know that the first known written source of the saying actually concerned pensions?
June 1891, UK daily The National Observer:
July 2016, Estonia, LHV financial portal:
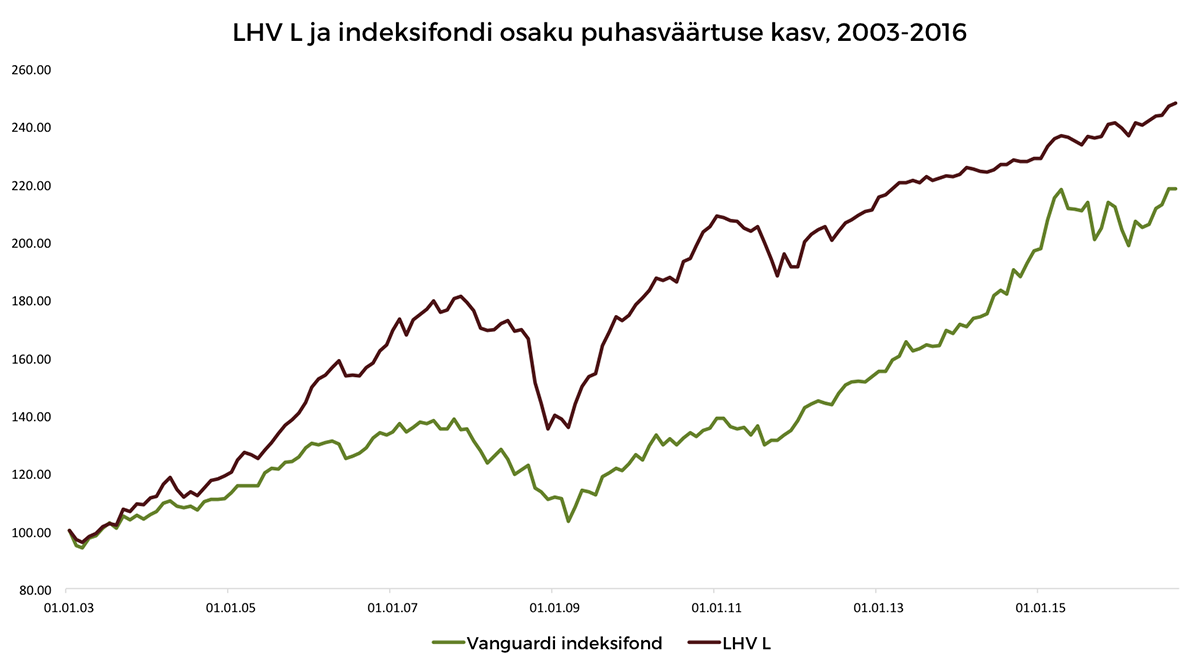
LHV’s Joel Kukemelk informed customersthat LHV’s pension fund L has succeeded in beating the index. Ever since the pension reform, the average annual yield of the fund has exceeded 7%!
“„Wow… Really?“ said Tuleva’s member Aivar*, looking at his pension account balance. He requested a balance of his pension account from the pension centre and calculated that his assets had generated less yield in the particular fund than announced by the management company. Even less than the yield he would have generated in an index fund. How is this possible?
Indeed, the particular diagram does not present the yield earned by Aivar or yourself. Rather, it presents the growth in the net asset value of unit of the LHV L fund from 2003 to the present day.
What does this mean?
The diagram shows how much the value of an investment made on a particular day in January 2003 has grown. If you are not yet 30, you were probably not working at the time. Thus, you made no investment in the pension fund.
However, if you were working at the time and had joined the second pillar and had opted for the LHV fund L, 6% of your gross salary was transferred to the fund on the particular day. If you were earning average Estonian salary, a little less than EUR 25 was transferred to the pension fund. The same EUR 25 has earned an annual average of 7%. More than the index. This is all statistically accurate.
But all of your subsequent second-pillar payments – either EUR 25 or EUR 250 at a time – are telling a different story. You will not find any information on these payments from the diagram. Therefore, you cannot measure the growth in your pension assets based on the increase in net asset value of unit.
When would it be possible to measure the return on investment based on the increase in net asset value of unit?
Let us suppose that you inherited your great aunt’s wealth at the beginning of 2003 and invested all of it in the LHV fund. In such a case, your investment would have earned exactly as much yield as presented in the diagram.
As mentioned before, this is not how pension contributions work: no-one can transfer a large amount of money in the second pillar; we all simply put a side a tiny portion of our salary every month. But let us suppose, for a second, that you received a once-in-a-lifetime inheritance from your aunt. What would the diagram show in such a case?
Average yield is considerable. In the first few years, the fund manager made daring decisions, generating a yield beyond the global market index. The same courage is also a likely reason behind LHV’s below-index performance during the global crisis of 2008. On the other hand, in the few years after the crisis, the growth in LHV’s investments surpassed the index.
One more thing. The current fund manager Andres Viisemann started to manage LHV’s pension funds at the beginning of 2007. The net asset value of unit of LHV fund L has failed to beat the index under his management. The reason for this is hard to determine.
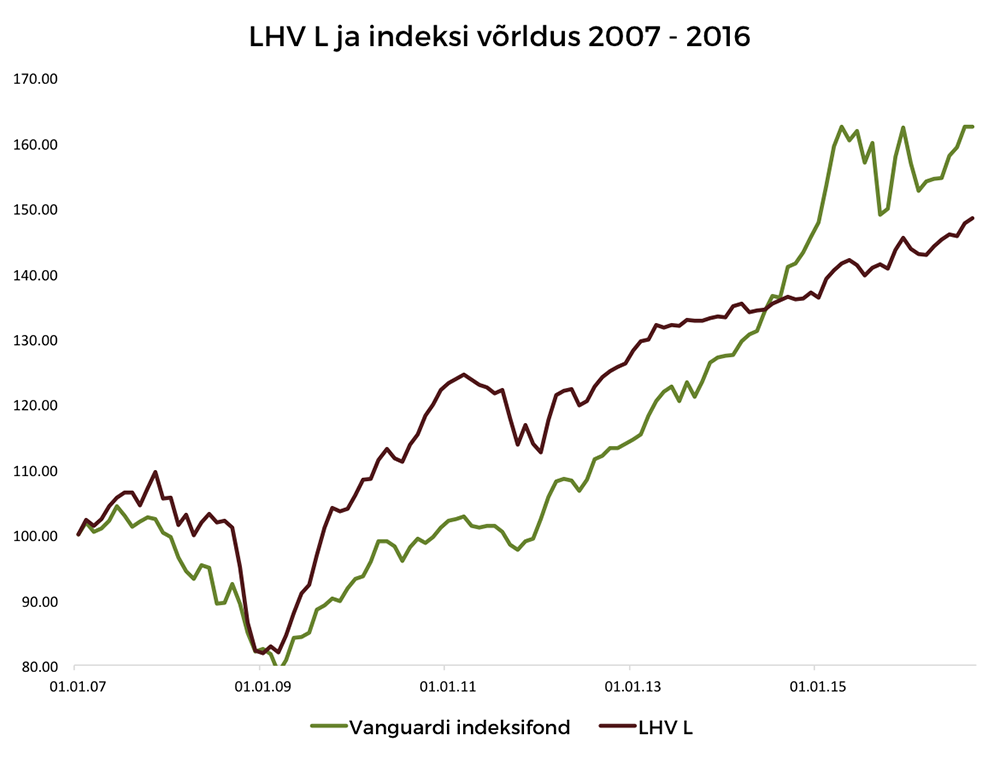
From 2007, the aunt’s heritage would have earned an annual yield of 4.2% under Andres, compared to the index fund’s 5.1%.
But this is all purely theoretical. Even if your aunt had left a handsome inheritance, there would have been no opportunity in 2002 and 2007 to invest the inheritance in the second-pillar pension fund. The law only allows and orders the direction of a tiny portion of your salary into the fund each calendar month.
Why this difference matters?
You start out by making tiny investments, and the assets will grow over time. The greater the amount accumulated on your pension account, the greater the influence of the value of the fund unit on your yield. To put it simply – 5% of EUR 25 is entirely different from 5% of EUR 2,500, is it not?
Let us take another look at the net asset value diagram. Until the end of 2006, the growth in the net asset value of fund L units clearly beat the index. The diagram for 2007-2011 looks like a roller coaster – it was a difficult time for the global securities markets. From the beginning of 2011 to the present day, the growth in the net asset value of units has remained below the index. Nonetheless, the net asset value of fund L units is higher, compared to the index fund, you say?
True, but this is where the cash flow comes to play, i.e. how much and when investors transfer money into the fund. By the end of 2006, investors had invested a total of EUR 10 million in LHV fund L. By the beginning of 2011, pension savers had invested a total of EUR 57 million. By today, the fund holds more than EUR 360 million.
This means that the investors’ yield is affected by the investment decisions of recent years several times more than by the value of fund units in the previous periods.
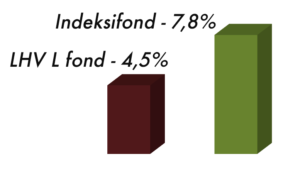
Thus, the growth in the net value of units is no indication of how well the invested money is doing. To find out how much an average investor has earned in the pension fund, you need to calculate the cash-flow-weighted rate of return. For this, you need some patience – I have made the calculations on your behalf. According to the information received from the pension centre, the investors of LHV fund L have earned an average of 4.5% in annual yield. In comparison, the same investment in Vanguard funds would have earned an average of 7.8% in annual yield.
How much has your second-pillar fund earned?
The last comparison reveals how much an average LHV fund L investor has earned and how much more they could have earned in the index fund. If you want to obtain information on your pension account yield, you need to calculate the weighted average of the yield of your monthly contributions up to the present day. This is the cash-flow-weighted rate of return.
Indeed, this is the calculation that would best reflect the quality of the work performed by the management company in your service. I bet all Estonian pension savers would like to receive information on the average rate of return of their pension account. Unfortunately, neither the pension centre nor any management company currently discloses such information.
If you have the time and interest, you can always calculate your yield based on the information received from the pension centre. This is exactly what Aivar did. Let us take a look at the yield generated in LHV fund L.
Aivar’s second-pillar pension fund has earned an annual average yield of 5.2% in LHV fund L. This results falls below the Vanguard index fund – had Aivar invested his assets in the index funds, he would have earned an annual average of 6.5%.
If average yield and Aivar’s income were the same for both LHV and Vanguard, Aivar would receive a 34% higher pension from Vanguard than from LHV, if he retired in 34 years. This means that investment in index fund would provide Aivar with one-third more money than investment in LHV fund
By the way, Aivar is 31 years old and started to work in 2002. Should you be of similar age, your pension assets are likely to show similar dynamics
LHV pension fund L ranks first among the Estonian funds, but still falls below the world average. A majority of pension savers have received a lower yield in LHV funds, compared to a potential investment in index funds.
Indeed, my initial idea was to use the help of IT engineers to set up a one-and-only calculator, which would allow you to effortlessly calculate the yield on your pension assets and to compare it against both the global market average (index) and inflation.

I have had help from numerous programmers from Estonia’s best IT companies. We have burnt a lot of midnight oil and spent many weekends on the project.
It would be very easy for a pension centre, which keeps account of the pension assets of all Estonian people, to programme such a calculator. For us, it has proven a much greater challenge than we initially thought. This is due to the availability of data. Namely, the pension centre allows downloading the pension account balance only as a pdf file – a format unsuitable for processing numbers
Please do not hesitate to request information on the average annual yield of your pension account from the pension fund management company and pension centre.
Make sure you also request a comparison with the index and inflation. Don’t be satisfied with the net asset value diagram, which says nothing about your yield. If people continue to show interest, the pension centre is bound to create an opportunity for all of us to examine and compare the yield of our pension assets.
We will see, who will be the first to create a pension calculator that calculates the yield of the pension assets and provides a comparison with the index and inflation: Tuleva, the pension centre (registrar financed by the taxpayer), some management company or a third party
It only takes a few minutes to transfer your pension to Tuleva. You do not have to be a member of Tuleva to transfer your pension, and changing funds doesn’t cost anything, you will be saving money on management fees instead! We have prepared a guide to help you out here:
* On Aivar’s request, his name has been changed.
** The diagram shows the change in the net asset value of unit, compared to the starting point (starting point = 100). 50% of the Vanguard index fund consists of the Vanguard Global Stock Index Fund Investor Share (VANGLVI) and 50% of the Vanguard Euro Government Bond Index Fund Investor Share’ist (VANEGBX). Both funds are available to European retail investors.

